Integrated Mitotic Stem Cell
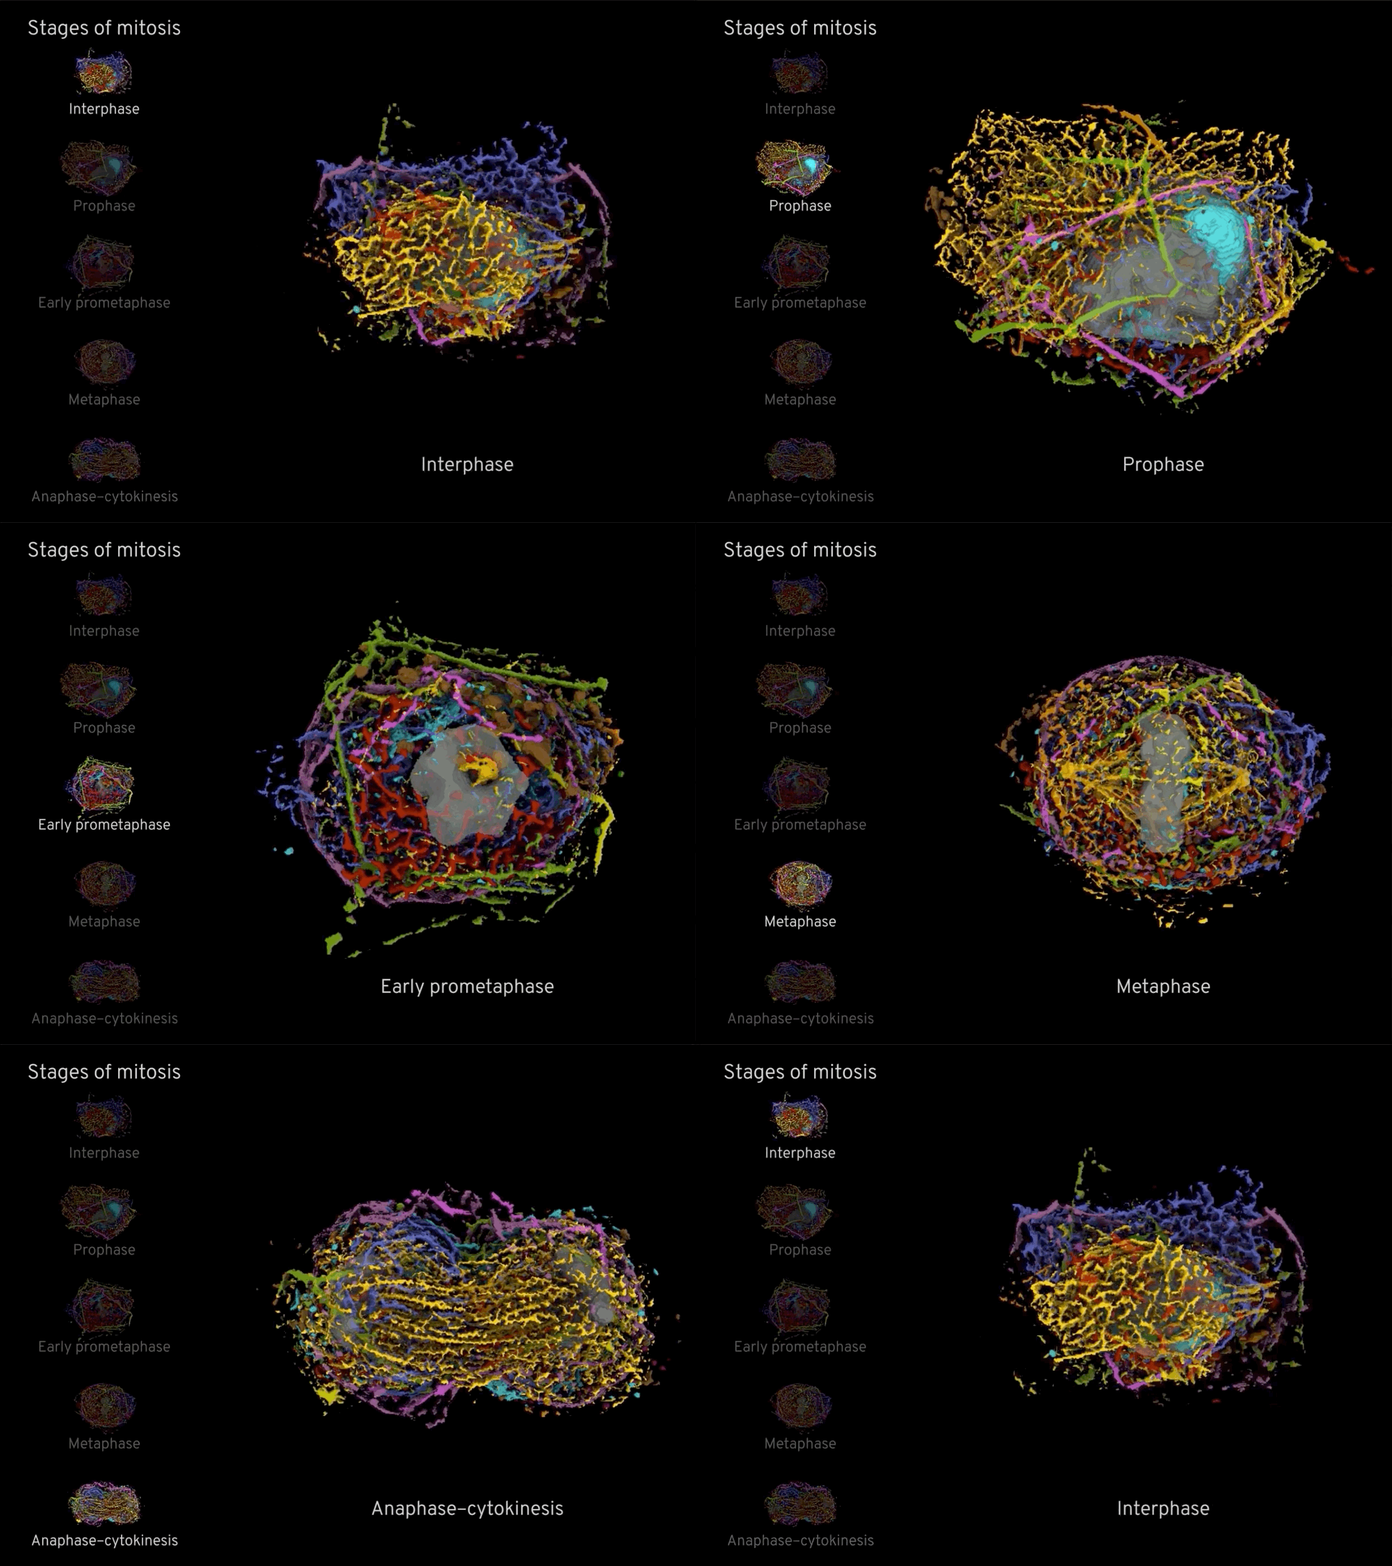
Mitosis is one of the most visually striking and most studied cell behaviors — a stepwise process in which a cell segregates its replicated DNA and divides. But no single image can show what every cellular structure is doing at each stage. The Integrated Mitotic Stem Cell project (IMSC) was built to do exactly that: a synthesis of thousands of single-channel images into one continuous 3D portrait of a dividing human stem cell.
The Allen Institute for Cell Science maintains a library of CRISPR-edited human iPS cell lines, each with an endogenous fluorescent tag on one cellular structure: TUBA1B for microtubules, CENT2 for centrioles, LMNB1 for nuclear envelope, SEC61B for endoplasmic reticulum, TOMM20 for mitochondria, ST6GAL1 for Golgi, FBL for nucleolus, LAMP1 for lysosomes, PMP34 for peroxisomes, ACTB for actin, ACTN1 for actin bundles, MYH10 for actomyosin bundles, TJP1 for tight junctions, DSP for desmosomes. Each line gives you one channel of truth. None of them gives you the whole cell.
A paper you can explore is a fundamentally different object than a paper you read.
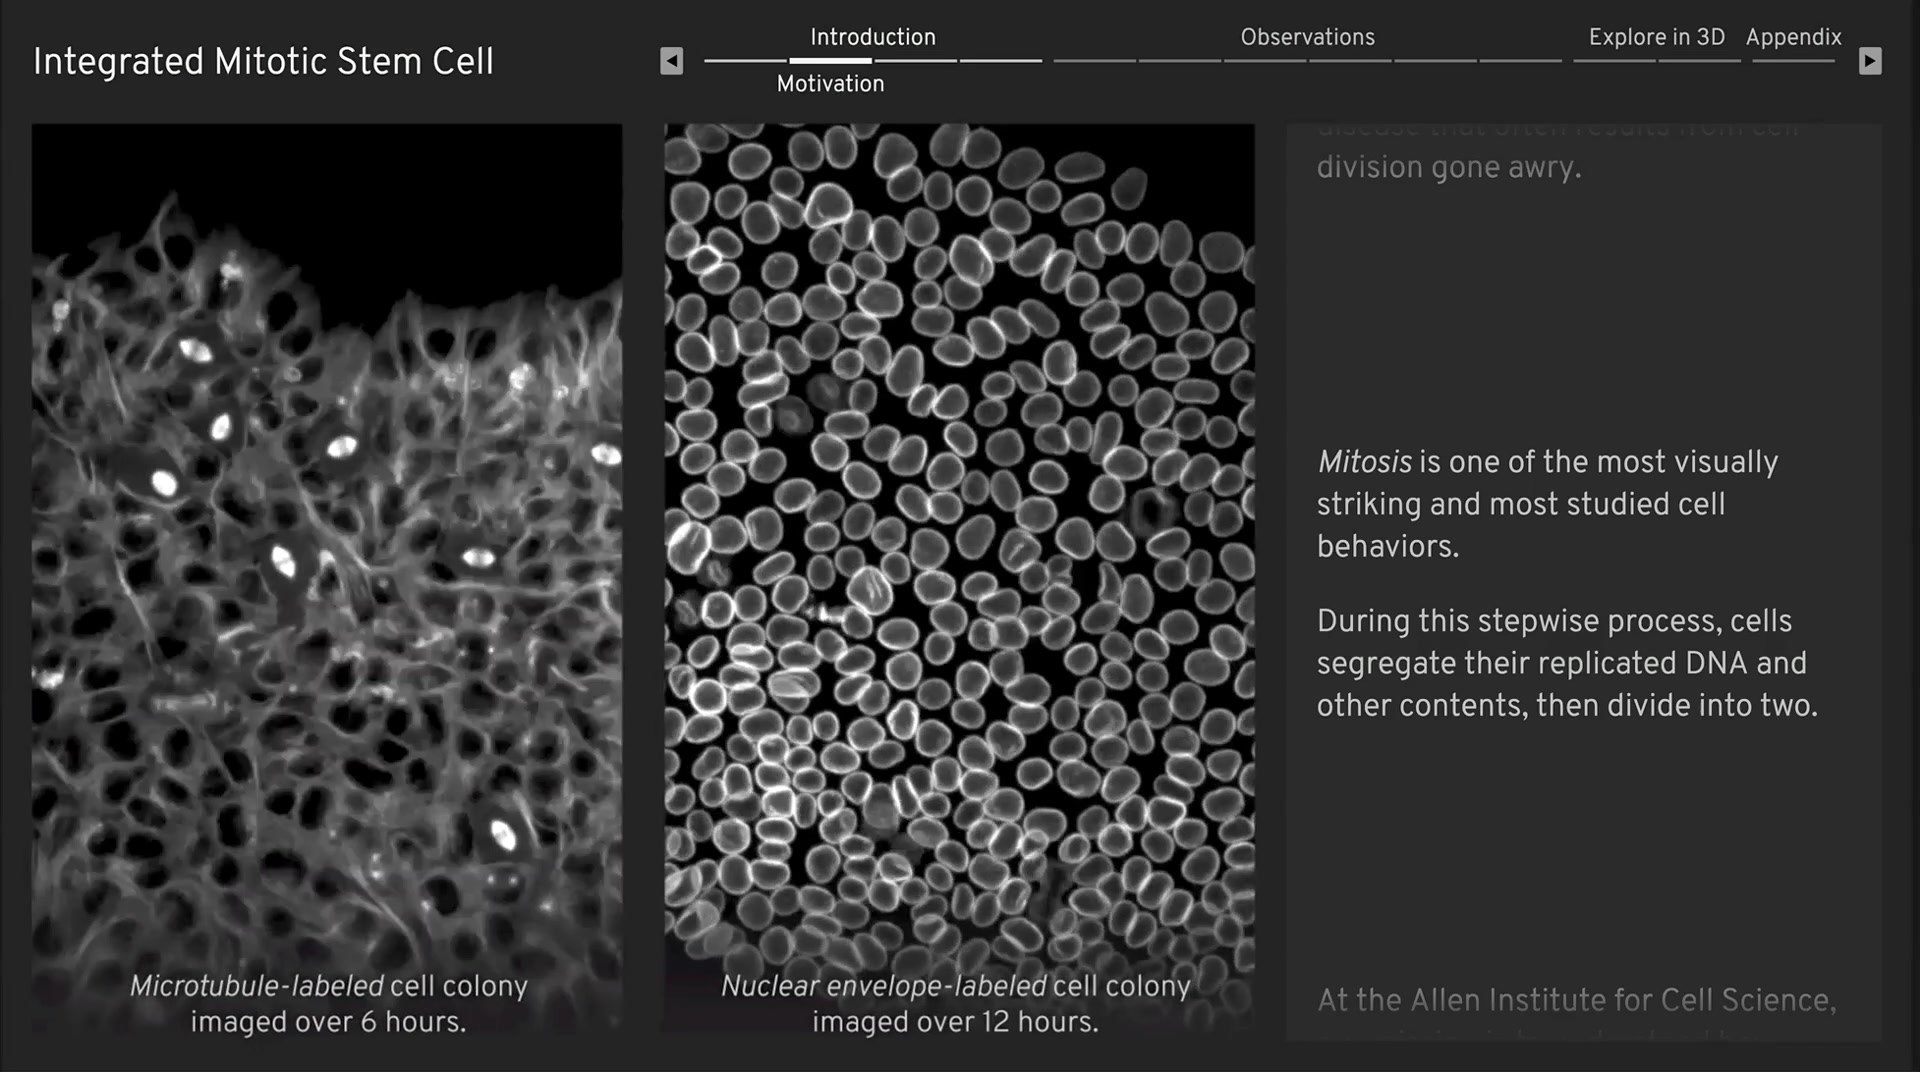
Tens of thousands of 3D images later, we had a strategy. Cells were collected in random states of the cell cycle, but we could classify each one into a mitotic phase (M0–M7, from interphase through anaphase-cytokinesis) by the shape and texture of its DNA stain. Then, because DNA was a shared landmark across every cell line, we could align cells phase-by-phase and superimpose the segmented structures into a single integrated model. The web piece presents the result as a visual essay with sections — Introduction, Motivation, Observations, Explore in 3D, Appendix — that walk a reader through the question, the method, the findings, and then hand them the data to investigate themselves.
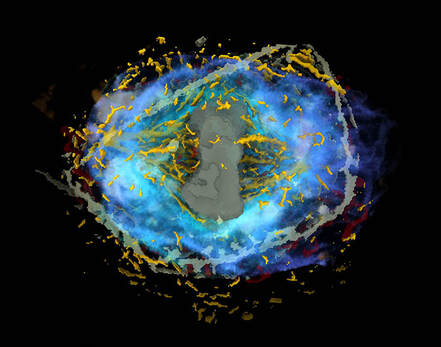
The Explore in 3D viewer lets readers toggle structure channels on and off, switch between mitotic stages, and adjust density, masking, clipping, and lighting in real time. The observations layer surfaces specific scientific findings the integrated view made visible — for instance, that lamin B1 associates with the peripheral ER during interphase and with the ER more broadly during mitosis, and that the Golgi fragments and disassembles before division and reassembles after. IMSC was an early test of what scientific publishing looks like when the data itself is the medium.